Creating a timeseries plot
First you need to login. Please follow the login instructions in the user guide.
Once the login procedure is done, processes are operable and data search and download within the ESGF data archive is possible.
In this timeseries plot example we will use the Flyingpigeon WPS. Make sure Flyingpigeon is installed and running and check that it is registered in Phoenix.
There are two ways to submit a job: either with Processes or Wizard.
While with Processes you can select single operational processes the Wizard is guiding you through the necessary steps to submit a job. For getting an idea of the operation procedure choose the Wizard tab:
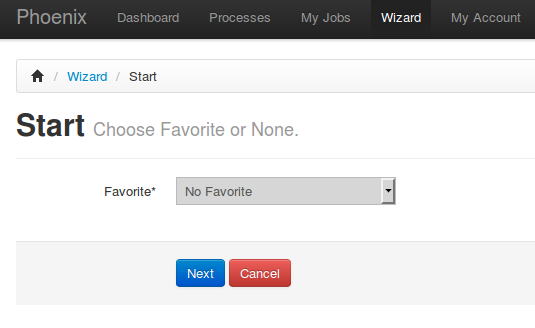
You could choose a favorite here of a previous run job but in this case please choose No Favorite and click Next.
The following steps are necessary to run a visualisation job:
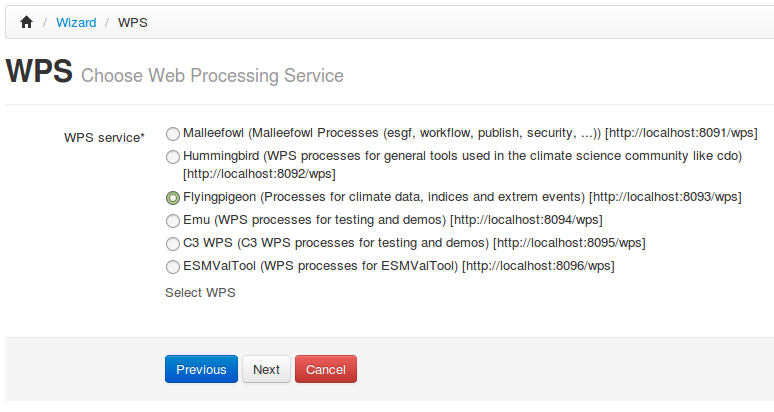
Select WPS Service
For this example choose the Flyingpigeon WPS service which has processes for the climate impact community.
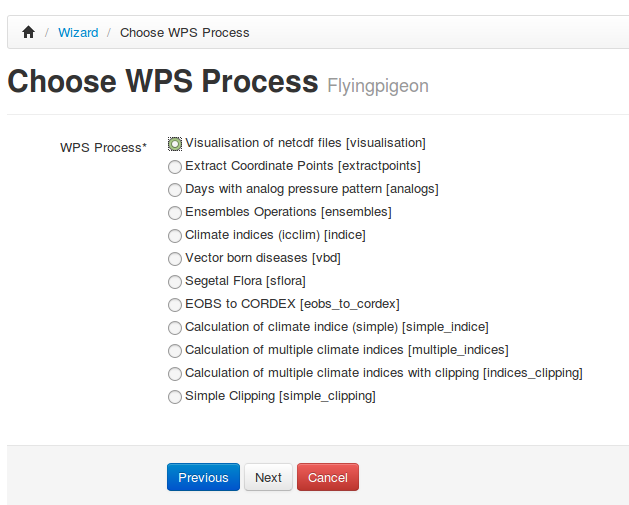
Choose Process
With clicking on Next you’ll find the list of available processes. Check the Visualisation of NetCDF files.
Enter Process Parameters
Click on Next which guides you to the process parameter:
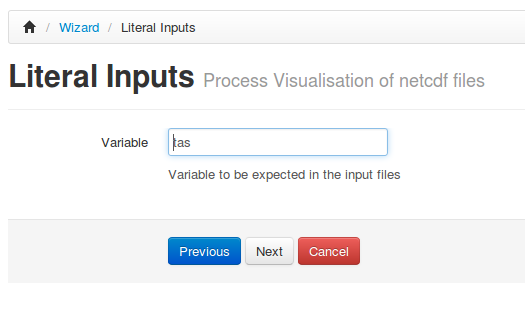
The values in the data files are stored with defined variable names. Here are the most common ones:
- tas – mean air temperaure at 2m (in Kelvin)
- tasmin – minimum air temperaure at 2m (in Kelvin)
- tasmax – maximum air temperaure at 2m (in Kelvin)
- pr – pricipitation fulx at surface (in kg/second)
- ps – air pressure at surface
- huss – specific humidiy (in Kg/Kg)
A list of available variable names used for CMIP5 and CORDEX experiment can be found in the Appendix B of the CORDEX archive design.
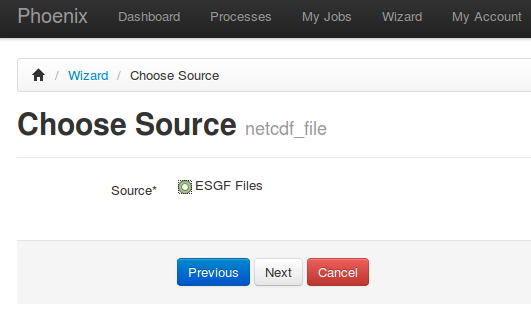
Select Data Source
In the next step you will choose the data source. Currently there is only the ESGF data archive:
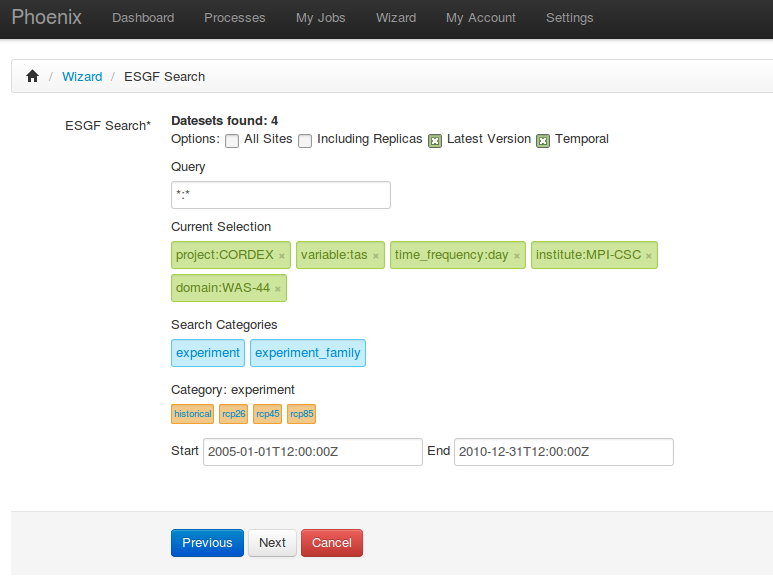
Search Input Files
This is a search GUI to find appropriate files stored in ESGF data archive. By selecting a Search Categorie (blue buttons), you can choose the appropriate options (in orange).
In this example select the following parameter:
| Categorie | Option |
|---|---|
| project | CORDEX |
| domain | WAS-44 |
| insitute | MPI-CSC |
| variable | tas |
| time_frequency | day |
Double selection (like two domains) can be realized with pressing Ctrl - tab.
For the visualisation process it is necessary that the selected variable (tas) is the same as the
variable argument in the Process Parameters
And optionally you can set the time bounds:
Start: 2005-01-01T12:00:00Z
End:   2010-12-31T12:00:00Z
The Selection should look similar to the following screenshot:
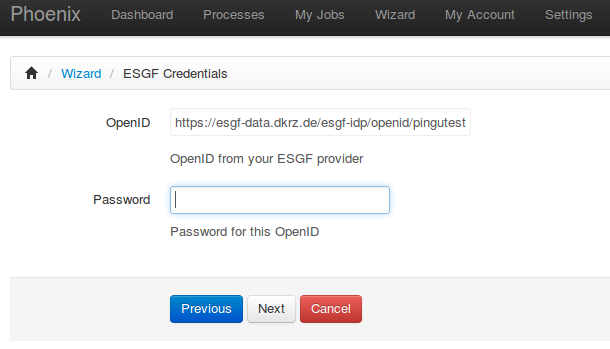
Check your credentials
To access ESGF data you need an x509 proxy certificate from ESGF. You can update your certificate in My Account. The x509 proxy certificate is valid only for a few hours. The wizard checks if your certificate is still valid and if not you will be asked to update it on the following wizard page.
Start the process
On the final page Done of the wizard you can give some descriptive keywords for your process. You can also save it as a favorite so that later you can run the same job again.
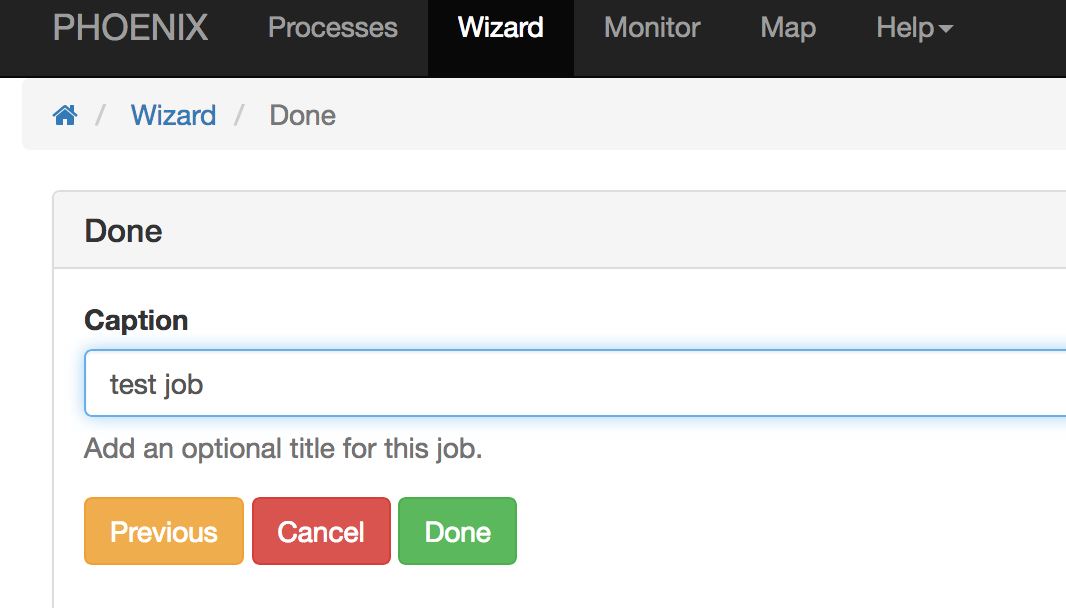
Press Done and the job will start.
Monitor running Job
The job is now submitted and can be monitored on the My Jobs page:
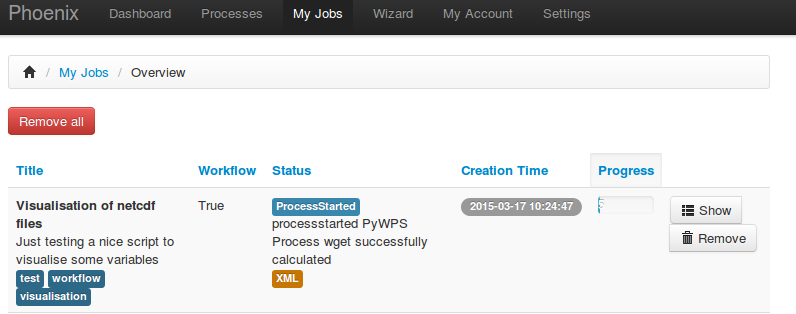
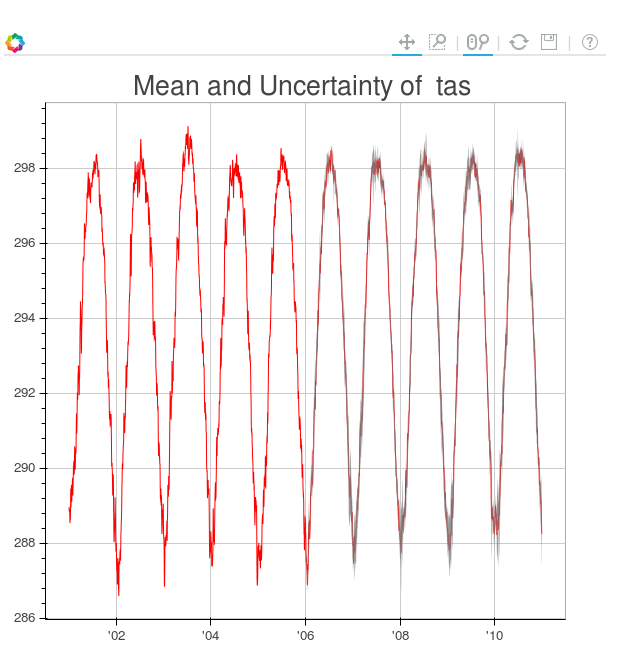
The job is running … data will be downloaded and the analyzing of the data starts. In this case, a field mean over the several experiments will be performed and an appropriate timeline drawn.
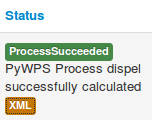
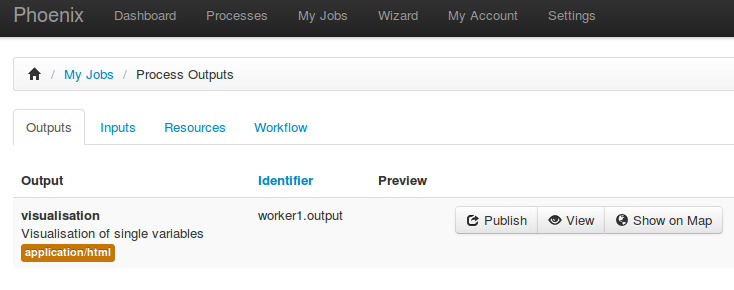
When the job has finished, the status bar is turning into green: